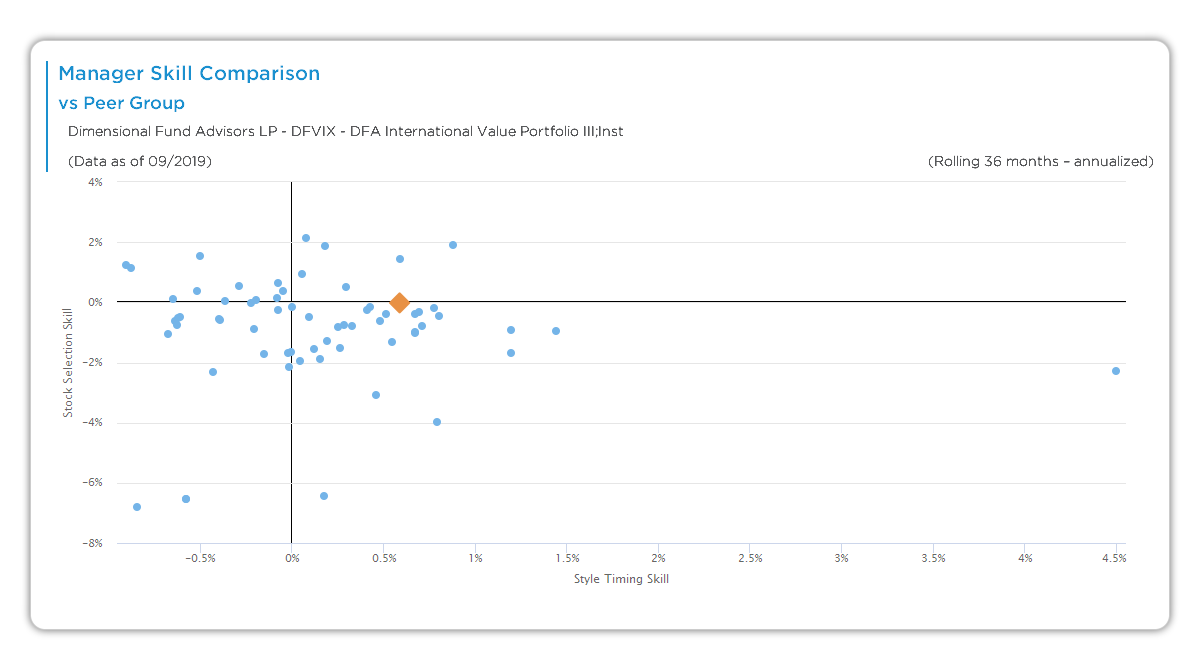
This interactive scatter plot positions your manager (orange dot) against all peers in a specific style universe, such as the Global Large High Quality Blend with 245 funds. It uses two key skill dimensions—stock selection skill and style timing skill—to show relative strengths over a user-selected time horizon. You can toggle between QTD, 1-year, 3-year, or 5-year periods to evaluate both short-term results and long-term persistence.
Chart Elements
The chart uses a standard scatter plot format with these core components:
- X-Axis (Style Timing Skill %): This measures the manager’s peer-relative performance in tactically rotating between factors or styles, such as shifting from value to growth at the right times. Values range from negative (underperformed peers) to positive (outperformed peers), for example from -7% to +5%. A dot further to the right indicates stronger timing skill compared to the peer group.
- Y-Axis (Stock Selection Skill %): This captures peer-relative outperformance from individual security picks after adjusting for style. Positive values (e.g., up to +10%) mean the manager selected stocks that beat what their dynamic style clone would predict; negative values (down to -20%) show underperformance in picks.
- Data Points:
- Blue Dots: Each represents one peer fund in the universe. The cloud of dots shows the full distribution—dense clusters indicate common skill levels, while outliers highlight exceptional or poor performers.
- Orange Dot: Your selected manager. Its position relative to the blue cloud tells the story of competitive standing.
- Zero Crosshairs: Vertical and horizontal lines at 0% divide the chart into four quadrants. The top-right quadrant is ideal (strong in both skills), while bottom-left signals weakness across the board.
- Labels and Context: The title notes the universe size (e.g., 245 funds), data as-of date (e.g., 12/2025), and current period (e.g., 3 Year).
- Interactive Features:
- Hover over blue dots: A tooltip bubble appears with the peer fund’s name and exact skill values, letting you quickly identify competitors.
- Double-click any dot: Opens the full Aapryl Dashboard in a new browser tab with that specific manager (peer or your own) pre-selected for deeper analysis.
- Period Dropdown: Switch between QTD (shortest, most volatile), 1YR, 3YR, or 5YR (longest, tests durability). Longer periods smooth out noise and better reveal sustainable skill.
How Skill Components Are Calculated
Both axes show annualized, peer-relative z-scores derived from Aapryl’s return decomposition model:
- Style Timing Skill: The difference between the dynamic clone (recent 36-month style) and static clone (fixed inception style), ranked against all peers in the universe. It isolates value added from factor rotations.
- Stock Selection Skill: Manager returns minus dynamic clone returns, ranked vs. peers. This pure residual measures idiosyncratic security-level decisions.
These are normalized so the peer average sits near zero, making positioning intuitive.
Key Insights to Spot
Look for these patterns to draw meaningful conclusions:
- Quadrant Dominance: An orange dot in the top-right quadrant means your manager beats most peers on both dimensions— a strong buy signal. Conversely, bottom-left placement warrants caution.
- Relative Outlier Status: If the orange dot sits far above or right of the blue cloud, the manager has a differentiated edge. Check if it’s consistently there across time horizons.
- Peer Dispersion: A tight cluster of blue dots suggests commoditized skill levels in the universe (harder to stand out). Wide spreads create more opportunities for alpha.
- Changes Over Time: Toggle from QTD to 5YR— if the orange dot migrates toward top-right in longer periods, it indicates improving or persistent skill rather than luck.
- Universe Robustness: With 245 funds, rankings are statistically meaningful; smaller universes require more scrutiny.
Actionable Uses
This chart shines in comparative and due diligence workflows:
- Competitive Scouting: Hover over top-right blue dots to note rival names, then double-click to open their Dashboards and compare processes head-to-head.
- Conviction Building: A stable top-right position across 3YR and 5YR horizons supports allocation decisions, especially with positive peer-adjusted alpha from other charts.
- Skill Gap Analysis: If your manager skews left (weak timing), ask targeted questions like “How do you handle factor rotations?” during meetings.
- Persistence Screening: Use the dropdown to filter managers who maintain strong quadrants over multiple periods, avoiding one-hit wonders.
- Quick Navigation: Double-click your own orange dot anytime for a full Dashboard view, or explore peers without leaving the analysis flow.
By combining hover details, double-click navigation, and time toggles, this chart turns peer benchmarking into an efficient, interactive tool for manager selection.