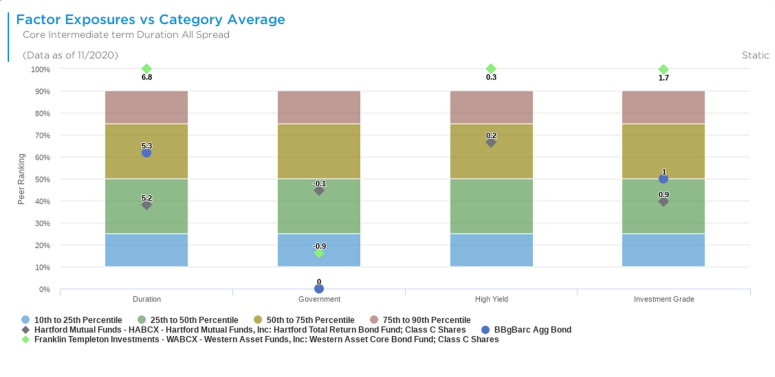
The chart shows the manager’s exposure or beta to various factors, sectors or risks calculated using returns based style analysis in comparison to its percentile ranking vs its Aapryl Peer Group.
Aapryl is a financial technology company that develops analytical tools for asset allocators to use for investment manager selection, portfolio construction and risk management activities. In addition, Aapryl offers a Manager Diagnostic analytical tool for investment managers wanting to understand how they are being viewed by investors and consultants.