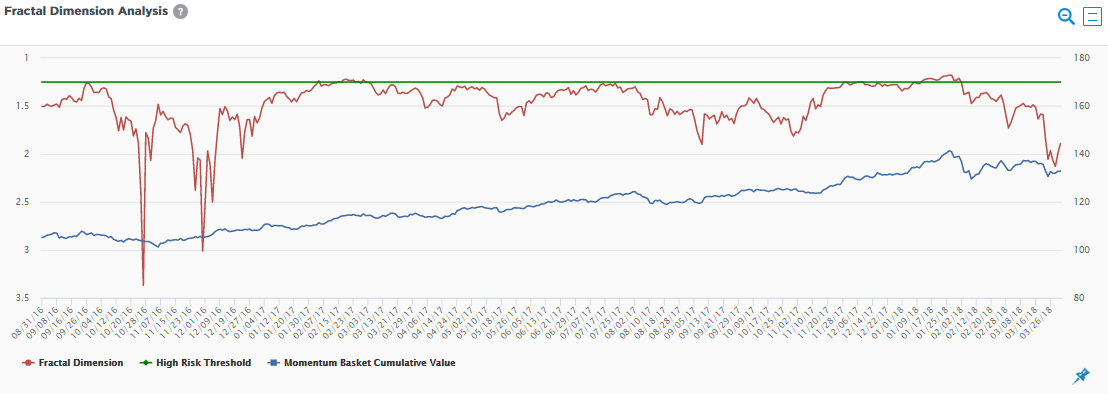
The chart is used to provide insight into whether a particular factor in a portfolio is crowded and therefore adds an extra dimension of risk. Aapryl’s fractal dimension analysis is based on research that shows that the time-horizon of different market participants is different and more importantly can view the same activity differently. Too much short-term activity can create liquidity risk. Aapryl analyzes the equilibrium of long-term and short term activity of the portion of a portfolio most exposed to a particular factor. The red line displays the equilibrium of the activity against a threshold (green line). When the red line touches or is above the green line it indicates that there is a high level of short term activity which may be an indication of crowding risk. The blue line displays the cumulative performance of the portion of the portfolio with high exposure to the factor.