This table-style chart provides a detailed numerical breakdown of a manager’s excess returns over its benchmark since inception. It separates outperformance into components like style effects, style timing skill, and stock selection skill, giving you a clear picture of what drove results and how repeatable it might be. The summary metrics at the bottom add predictive power and statistical context to guide your decisions.
Chart Elements
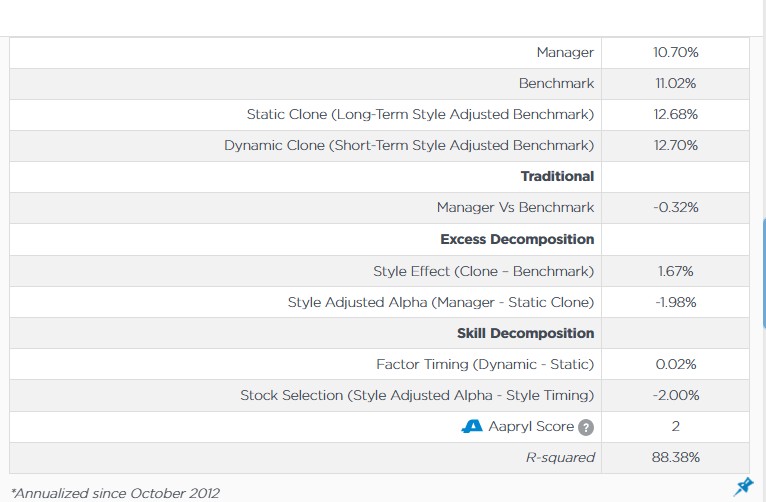
The chart is structured in sections, with each row showing annualized excess returns (positive = outperformance) calculated over the full track record. Here’s what every line means:
Top Section – Total Excess Returns
These rows compare overall performance against the broad benchmark (e.g., MSCI World):
- Manager vs Benchmark: The manager’s total annualized excess return. For example, 12.4% means the fund grew faster than the benchmark by this amount annually since inception. This is your headline number—what most people start with.
- Static Clone (Long-Term Style Adjusted Benchmark): A passive portfolio built to match the manager’s fixed, inception-period factor exposures (think quality, value, size, momentum). If this shows 10.7%, it tells you what a “buy-and-hold” version of the manager’s style would have delivered vs. the benchmark.
- Dynamic Clone (Short-Term Style Adjusted Benchmark): Like the static clone but rebalanced every 36 months to reflect recent style changes. A value like 10.5% shows if short-term tactical tilts in factors helped or hurt relative to the benchmark.
Middle Section – Style and Alpha Attribution
This bridges raw excess to skill:
- Style Effect (Clone Benchmark – Benchmark): The passive contribution from the manager’s overall factor tilts. -0.75% would mean the style itself underperformed the broad benchmark—perhaps quality/value factors lagged during a growth-led market.
- Style Adjusted Alpha (Manager – Static Clone): Pure active return after stripping out long-term style. 2.1% here means the manager added this much value through decisions beyond just holding their stated style.
Bottom Section – Factor Skill Decomposition
The real insight—breaks active return into timing vs. picks:
- Style Timing (Style Adjusted Alpha – Dynamic Clone): The portion from tactically rotating factors (e.g., overweighting value during its cycles). 0.5% indicates modest timing skill.
- Stock Selection (Style Adjusted Alpha – Style Timing): What’s left after timing—idiosyncratic wins from individual security choices. 1.5% shows strong bottom-up alpha.
Summary Metrics (at the very bottom):
- Aapryl Score (1-5 scale, where 1 is best/high skill persistence and 5 is worst/low persistence): A forward-looking rating based on the consistency and magnitude of skill components above. A score of 1 suggests high odds of repeating top-quartile performance; 5 flags likely mediocrity.
- R-squared: Measures how well the clones explain the manager’s returns (75.76% means style/timing account for ~76% of variance; higher is more reliable decomposition).
How Decomposition Works
Imagine total excess return as a math equation:
Manager vs Benchmark = Style Effect + Style Timing + Stock Selection
- The clones act as subtractors: Static removes long-term style, dynamic removes short-term style too. What’s left is pure skill.
- All figures are annualized since inception (e.g., “Oct 2014” start date), so they smooth over market cycles. Positive values in skill rows add up to explain the top-line excess; negatives reveal drags.
Key Insights to Spot
- Where Alpha Comes From: If stock selection dwarfs style timing, the manager excels at picks, not market timing—great for bottom-up strategies.
- Style’s Role: Negative style effect? The manager’s factors underperformed broadly, so credit goes to skill overcoming that.
- Decomposition Reliability: R-squared over 70-80% means the clones fit well; below 50% suggests unique bets or data noise.
- Future Potential: Pair strong skill rows (e.g., >1% selection) with a low Aapryl Score (1-2) for high-confidence picks.
Actionable Uses
- Validate Manager Stories: If they claim “we’re stock pickers,” demand dominant stock selection and low style timing reliance.
- Build Portfolios: Use breakdowns to balance timing-heavy vs. selection-heavy managers for diversification.
- Screen Efficiently: Set filters like Style Adjusted Alpha >1%, Aapryl Score ≤2, R-squared >70%.
- Monitor Changes: Recalculate for rolling periods—if stock selection shrinks, dig into recent decisions.