
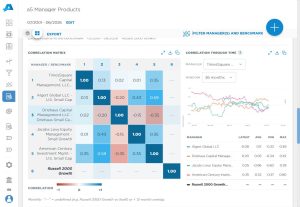
While the Correlation Matrix summarizes a single number for the full period, the relationship between two managers rarely stays constant. This chart tracks how one selected manager’s correlation to each of its peers has moved over time, using a rolling window of monthly excess returns.
Chart Elements
- Manager selector: Choose the manager whose relationships you want to trace; every peer line is recalculated relative to that manager.
- Window selector: Choose the rolling window length, 12, 24, 36, or 60 months. Shorter windows react faster to recent change; longer windows smooth out noise.
- Chart lines: Each colored line is the rolling correlation between the selected manager and one peer, recalculated and plotted for every month in the date range.
- Hover detail: Hovering over the chart shows the exact rolling correlation for every peer in that specific month.
- Summary table: Below the chart, Latest, Avg, Min, and Max summarize each peer’s rolling correlation across the full history shown.
How It Works
For each month, Aapryl computes the correlation of the selected manager’s trailing excess returns, over the chosen window, against each peer’s trailing excess returns over that same window, then plots that value as a single point on the corresponding line. Sliding the window forward one month at a time produces the full time series, so each line traces how a relationship has strengthened, weakened, or reversed.
Key Insights to Spot
A line that stays consistently high signals a durable, structural similarity between two managers. A line that swings between strongly positive and negative territory signals an unstable relationship that a single-period correlation would mask. Compare the Min and Max columns in the summary table: a wide range means the current reading may not be representative of how the pair behaves going forward.
Actionable Uses
Use this chart to confirm whether a diversification benefit seen in the Correlation Matrix has been persistent or is a product of a particular period. It is also useful for spotting style drift, since a manager whose correlation to peers changes markedly after a certain date may be behaving differently than in the past, and for choosing an appropriate rolling window length when monitoring managers going forward.