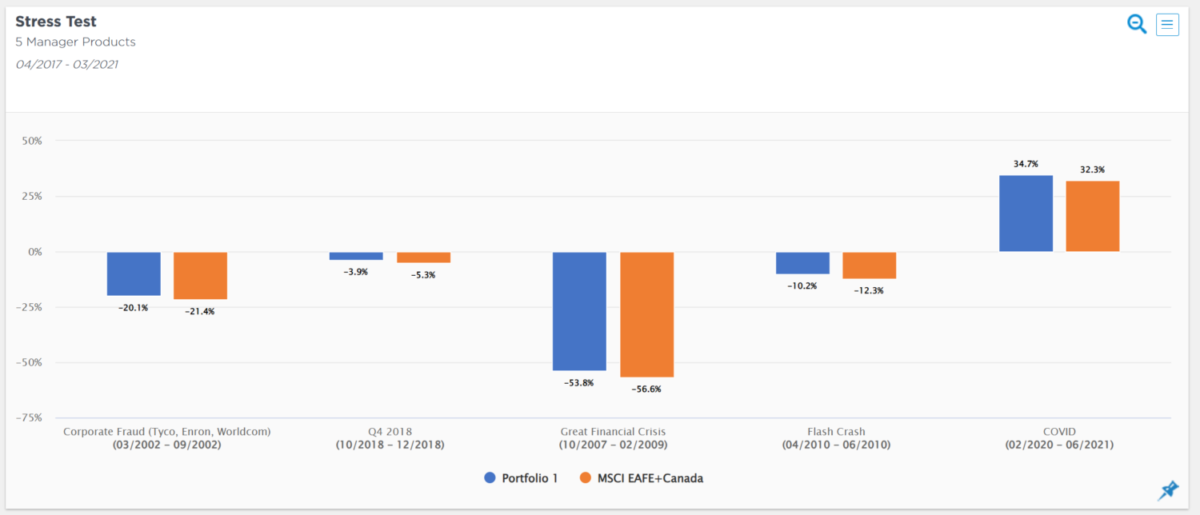
The stress test chart shows the hypothetical performance of portfolios and benchmarks at various periods in time in which the market was under stress. The chart can show a single portfolio across different stress periods or a group of portfolios for a single stress period.