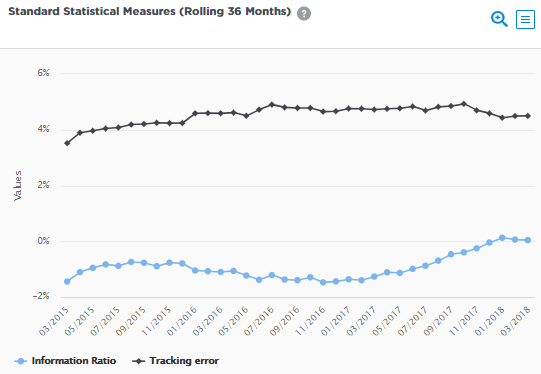
This dual-panel line chart tracks key risk-adjusted metrics over rolling periods (e.g., 36 months), helping you evaluate consistency of manager performance relative to the benchmark. Switch dropdowns to compare metrics like Information Ratio vs. Tracking Error, revealing trade-offs between return and risk.
Chart Elements
Common Structure (both panels identical layout):
- X-Axis: Time series of periods (e.g., monthly ends from 2017 to 2025), showing evolution across market cycles.
- Y-Axis (Left): Primary metric scale (e.g., Information Ratio from -1.0 to +1.6; positive = skill).
- Y-Axis (Right): Secondary metric scale (e.g., Tracking Error % or Ann. Volatility % from 0% to 16%).
- Lines:
- Solid Blue: Primary metric (e.g., Information Ratio = excess return / tracking error).
- Dashed Blue: Secondary metric (e.g., Tracking Error % = annualized std. dev. of excess returns).
- Dropdown Selections:
- Top Dropdown (e.g., “Information Ratio”): Choose primary metric—Information Ratio, Tracking Error, Ann. Volatility.
- Bottom Dropdown (e.g., “Tracking Error %”): Pair with secondary—Tracking Error, Ann. Volatility, etc.
- Rolling Period: Fixed (e.g., 36 months) smooths noise; reveals trends without short-term outliers.
Panel Examples:
- Top Panel: Information Ratio (left) vs. Tracking Error (right)—IR peaks when excess is high relative to risk.
- Bottom Panel: Same pairing, confirming consistency across views.
How Metrics Are Calculated
All vs. benchmark (e.g., MSCI World), annualized over rolling windows:
- Information Ratio (IR): Excess return / Tracking Error. >0.5 good; >1.0 excellent; negative = value destruction.
- Tracking Error %: Std. dev. of monthly excess returns (active risk); 4-8% typical for equities.
- Volatility %: Std. dev. of total returns (absolute risk).
These capture both reward (numerator) and risk denominators, spotting if high returns come from skill or volatility.
Key Insights to Spot
- IR Stability: Consistent >0.5 line signals repeatable risk-adjusted skill; sharp drops flag regime issues.
- Risk/Return Trade-off: Rising tracking error with flat IR means more risk for same reward—watch for spikes.
- Volatility Patterns: High vol periods correlating with low IR indicate poor navigation.
- Dropdown Power: Switch to IR vs. Volatility to see if absolute risk drives issues; Tracking Error vs. Volatility isolates benchmark deviation.
Actionable Uses
- Consistency Gauge: Favor managers with stable >0.5 IR through cycles.
- Risk Budgeting: Cap allocations where tracking error >10% unless IR compensates.
- Regime Analysis: Zoom on downturns—does IR hold or collapse?
- Comparisons: Standardize dropdowns (e.g., 36-mo IR vs. TE) across managers for screening.