The Skill Screening module streamlines manager selection by combining Aapryl’s proprietary skill metrics with extensive filterable data fields. Users define a starting universe through primary filters, customize the results table with 50+ columns including the 9 factor exposures and dozens of performance/ownership metrics, then apply secondary filters to narrow to high-probability outperformers. The Run Analysis button launches full style/skill dashboards on selected managers.
Module Elements
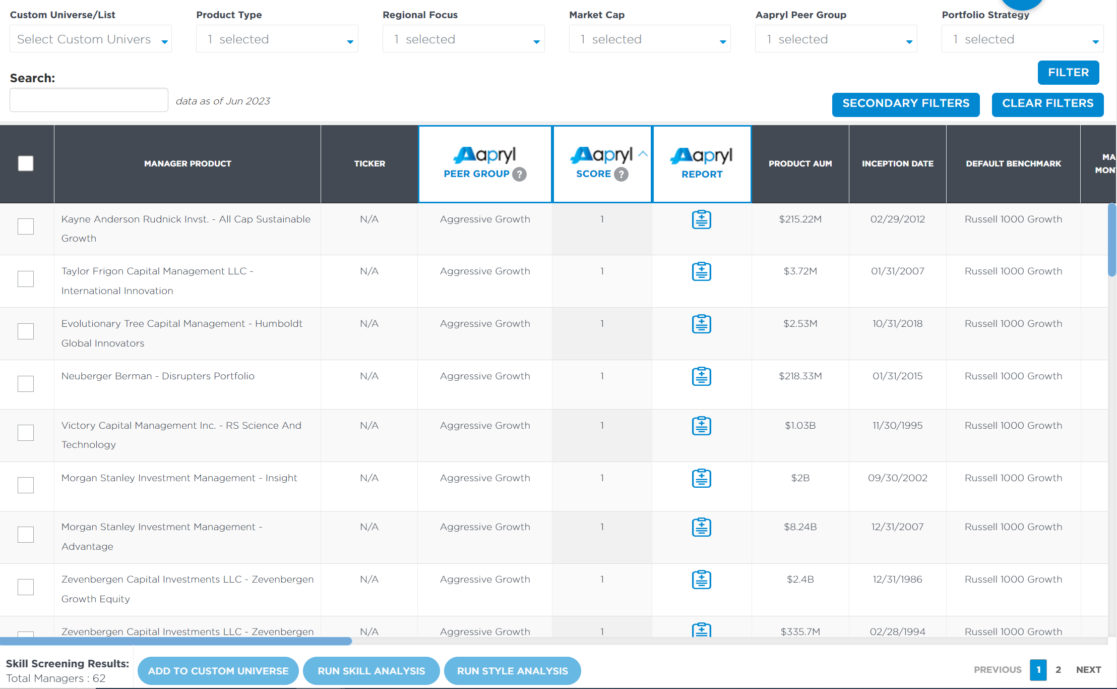
The top row contains primary filters including Custom Universe (add button), Product Type, Regional Focus, Market Cap, Aapryl Peer Group, and Portfolio Status. Below sits the Secondary Filters section with a Clear button and ability to add numeric/text filters. The main results table shows Manager/Product names, Aapryl Score, and Aapryl Probability, with black column headers enabling sorting. Action buttons include Run Analysis/Style Analysis, Save Report, and Next. A date selector shows “as of” periods like Jan 2020.
How It Works
Users start by selecting primary filters to define the investment universe – for example, choosing “Global Large High Quality Blend” under Aapryl Peer Group narrows to that style universe. The results table populates automatically, showing all managers matching the criteria. Users customize visible columns from 50+ options including the 9 factors (Value, Core, Growth, Defensive, Economic Sensitivity, Momentum, Quality, Yield, Low Volatility) plus their % exposures, Aapryl Report links, Product AUM, Inception Date, Fees, benchmarks, 12-month returns, Edge and Consistency Scores for Stock Selection and Factor Timing, ownership diversity metrics, ESG assets, Market Cycle Placement, expected alpha, yields, holdings count, and regional focus. Columns can be sorted by clicking headers; secondary filters refine further (e.g., Edge Score > 1.0, Women Owned > 10%). Selected managers feed into Run Analysis for complete dashboard views.
Key Insights to Spot
Aapryl Probability above 70% identifies managers with high odds of top-quartile performance over 3 years. Edge Score dominance in Stock Selection versus Factor Timing reveals whether alpha comes from security picks or style rotations. Ownership fields (Minority, Women, Hispanic, Asian, African American, Native American, Disabled, Women, Veteran) support diversity mandates. Market Cycle Placement shows optimal economic phases. Long inception dates with low fees balance experience against cost drag.
Actionable Uses
Screen for Aapryl Probability >60% AND Edge Score >1.0 to build shortlists likely to outperform. Filter diversity ownership + ESG % for institutional mandates. Sort by Consistency Scores to prioritize stable processes. Export results to Excel for RFPs. Click “Run Analysis” on top candidates to access full style decomposition and skill attribution dashboards. Use Custom Universe for proprietary peer groups. Secondary filters like “No. of Long Holdings < 100” isolate concentrated managers.
(Fixed Income Version)
The Fixed Income Skill Screening module streamlines identification of top-performing bond managers by combining Aapryl’s skill metrics with FI-specific sector exposures and risk attributes. Users define universes through primary filters, customize results with 50+ columns including the 29 fixed income sectors plus performance and ownership metrics, then refine via secondary filters to pinpoint high-probability outperformers relative to Core benchmarks.
Module Elements
Primary filters include Custom Universe (+ button), Product Type, Portfolio Strategy, and Aapryl Categories tailored for fixed income. Secondary Filters section features Clear All functionality. Results table displays Manager/Product names, Aapryl Score icons, and customizable FI-optimized columns. Action buttons launch Run Analysis, Run Style Analysis, Save Report, and proceed to Next. Date selector shows analysis “as of” specific periods like Jan 2020.
How It Works
Users select primary filters to target fixed income universes—such as Core Investment Grade, Credit Intermediate, or EM Hard Currency—automatically populating the table with managers matching criteria. Customize visible columns from extensive FI list: 29 sector exposures (US TIPs, Muni Ultra Short/Short/Intermediate/Long/HY, US Corp Short/Intermediate/Long, HY Short/Intermediate/Long, Credit Short/Intermediate/Long, Bank Loans, Agency MBS, Asset Backed, Treasuries Short/Intermediate/Long/T-Bills, Non-US Supra-Govt, Gov & Agency, EM Sovereign/Core/HY/Hard Currency/Local, Global HY, International TIPs/Core/Corp/Sovereign) plus % allocations, alongside Aapryl Report links, Product/Firm AUM, Inception Date, Fees, Primary/Default Benchmarks, 12-month Returns (Manager/Benchmark), Edge/Consistency Scores (Security Selection/Factor Timing), ownership diversity percentages (Minority, Women, Hispanic, Asian, African American, Native American, Disabled, Veteran), ESG Assets %, Market Cycle Placement, Expected Alpha, Yields (30-day/12-month), Duration, Credit Quality, Holdings count, and Regional Focus. Sort by clicking column headers; apply secondary filters like Duration <5.0 or Agency MBS exposure >20%; Run Analysis generates complete style decomposition dashboards.
Key Insights to Spot
Managers with Agency MBS + Treasuries Intermediate dominance signal liquidity focus; EM HY + Bank Loans tilts flag yield-seeking. Edge Score superiority in Security Selection over Factor Timing identifies strong credit pickers versus duration timers. High Aapryl Probability (>70%) combined with Minority/Women ownership supports dual mandates. Long inception dates paired with competitive Fees reveal cost-efficient track records. Market Cycle Placement in Stress phases ensures credit cycle coverage.
Actionable Uses
Screen Core Investment Grade + Probability >60% + Duration 4-6 for intermediate mandates; filter Muni Intermediate + Consistency Score >0.8 for tax-exempt core; target Credit Long + Expected Alpha >1.5% for satellite. Apply diversity filters (Women Owned >10%) + ESG Assets % for institutional RFPs. Sort descending by Aapryl Expected Alpha to prioritize. Click Run Style Analysis on shortlisted managers to access sector decomposition and risk attribution. Save frequently-used FI universes (HY Short + EM Local) as Custom Universe templates for recurring screens.