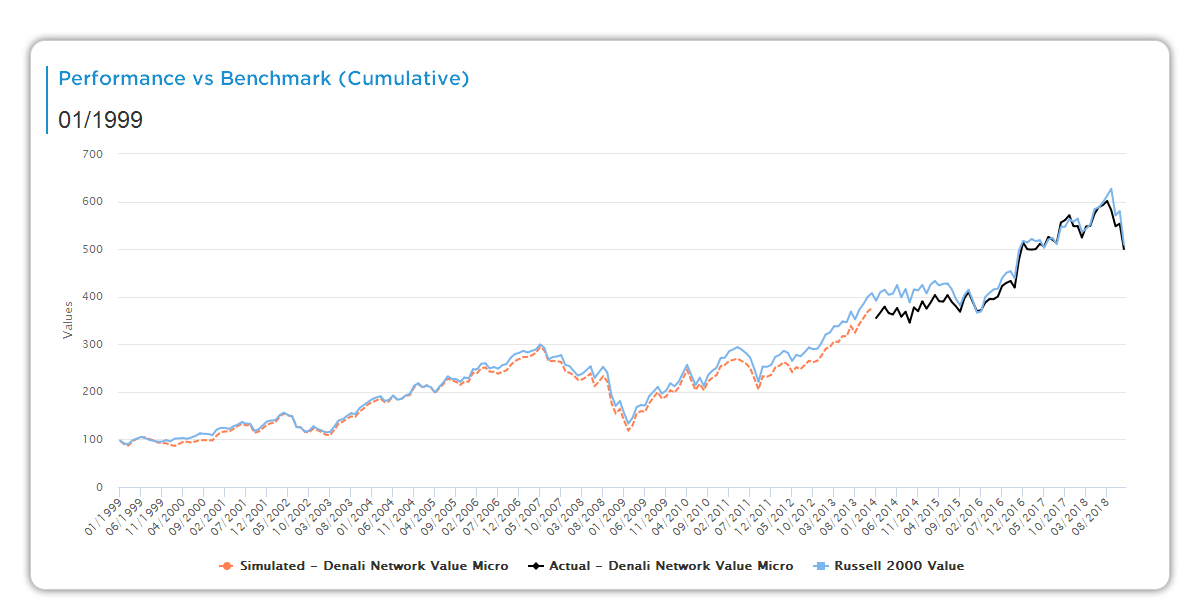
Users can see the long term back-filled history in a growth chart. While the entire history of the manager is shown, the simulated return is differentiated from the actual return by being being shown in red.
Aapryl is a financial technology company that develops analytical tools for asset allocators to use for investment manager selection, portfolio construction and risk management activities. In addition, Aapryl offers a Manager Diagnostic analytical tool for investment managers wanting to understand how they are being viewed by investors and consultants.