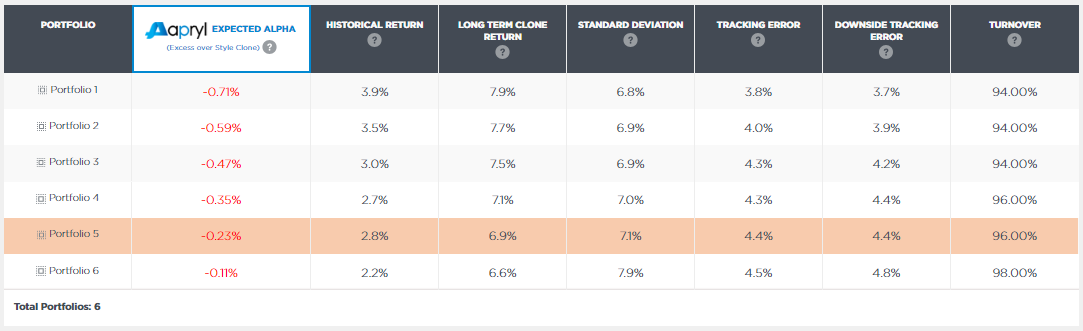
The Optimized Portfolio Table shows statistics on the portfolios created by the optimization. The portfolio statistics displayed include Aapryl expected alpha, historical return, long term clone return, standard deviation, information ratio, tracking error, downside tracking error and turnover. The historical statistics are calculated from the start date entered when running the optimization.