This chart analyzes how a manager performs across different market environments, helping investors determine whether results are driven by repeatable skill or broader market conditions.
Aapryl identifies market regimes—such as Rising Trends, Falling Trends, or No Trend periods—based on relevant market indicators. Performance statistics are then calculated separately within each environment.
By evaluating performance within each regime, users can see when a strategy tends to add value, when it struggles, and how it behaves across market cycles.
Users can also dynamically compare the actual manager, the manager’s clone, and a selected benchmark, enabling deeper analysis of performance drivers.
Chart Elements
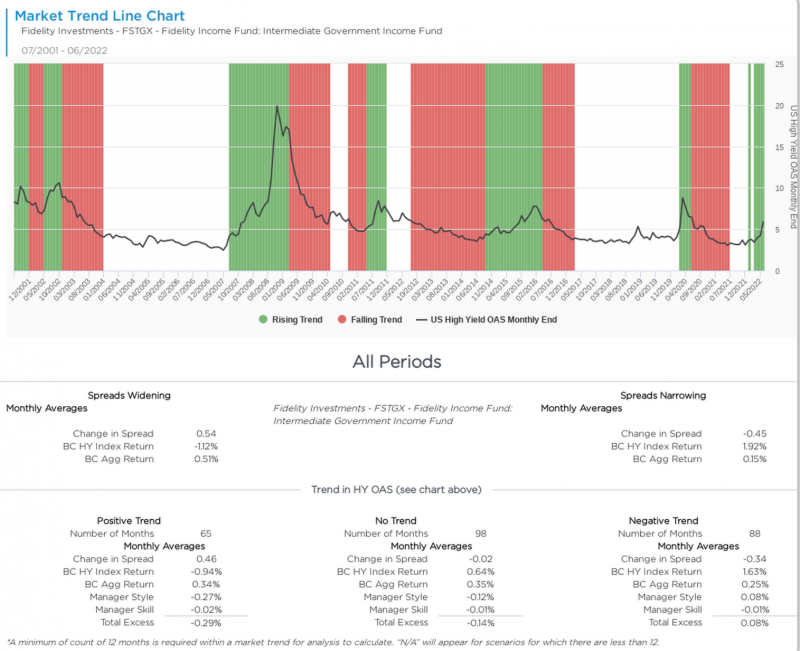
Market Trend Line Chart
- Black Line (Market Indicator)
The selected market indicator used to determine the market trend environment.
Examples may include credit spreads, volatility measures, or other macro indicators depending on asset class. - Green Background – Rising Trend
Periods where the indicator signals improving or favorable market conditions. - Red Background – Falling Trend
Periods where market conditions are deteriorating or becoming more challenging. - Neutral/White – No Trend
Periods where the indicator does not show a clear directional trend. - X-Axis
Time periods across the manager’s track record. - Y-Axis
Value of the selected market indicator.
These colored regimes divide history into distinct environments so users can evaluate how strategies behave during different phases of the market cycle.
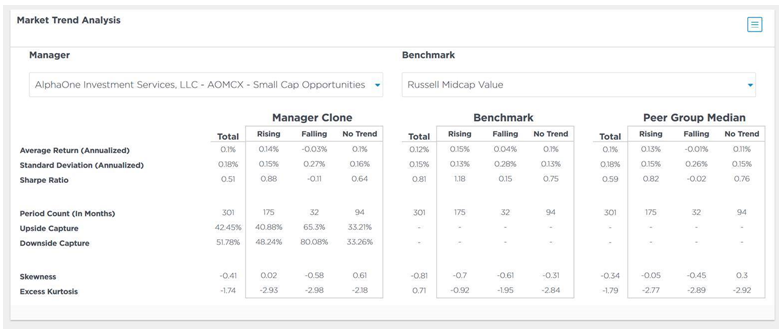
Market Trend Performance Table
The performance table summarizes results across each identified regime.
Columns include:
- Total – Performance across the full time period
- Rising Trend – Performance during improving market conditions
- Falling Trend – Performance during declining environments
- No Trend – Performance during neutral or mixed conditions
Rows show performance statistics for:
- Selected Strategy (Manager or Clone)
- Selected Benchmark
- Peer Group Median
Interactive Controls
The chart allows users to customize the analysis to match their research workflow.
Strategy Selection
Users can choose to analyze:
- Manager (Actual Fund) – The real performance of the strategy
- Manager Clone – A style-adjusted benchmark designed to replicate the manager’s systematic exposures
This allows investors to compare how the manager performs relative to what their style alone would have delivered.
Benchmark Selection
Users can also select their own benchmark for comparison.
This flexibility allows investors to:
- compare performance against traditional market indices
- test different benchmarks relevant to their investment process
- evaluate performance against internal or custom benchmarks.
Key Metrics Explained
- Annualized Return
Average annual return generated during the specified market environment. - Standard Deviation (Annualized)
Measures return volatility within that environment. - Sharpe Ratio
Risk-adjusted performance showing how efficiently the strategy converts risk into return. - Period Count (Months)
Number of months included in each trend regime. - Upside Capture
Percentage of benchmark gains captured during rising markets. - Downside Capture
Percentage of benchmark losses experienced during declining markets. - Information Ratio
Risk-adjusted excess return relative to the selected benchmark. - Tracking Error
Degree of deviation between strategy returns and the benchmark.
Market Trend Methodology
Aapryl uses objective trend detection models to identify different market regimes.
The specific indicator used varies by asset class.
Fixed Income Strategies
Trend models may incorporate indicators such as:
- Credit spreads
- Yield curve behavior
- Credit market conditions
Equity Strategies
Trend regimes may use indicators related to:
- Market momentum
- Volatility conditions
- Equity market risk cycles
Each time period is classified as Rising, Falling, or No Trend, and performance metrics are calculated within each environment.
This framework helps investors evaluate how strategies behave under different market conditions rather than relying on a single aggregate performance number.
Key Insights to Spot
- Environment Sensitivity
Compare performance across regimes to identify when the strategy performs best. - Defensive Characteristics
Lower downside capture during Falling markets may indicate strong risk management. - Skill vs Style
Comparing the manager to the clone helps determine whether results come from active decisions or underlying style exposure. - Benchmark Context
Using different benchmarks helps determine whether performance reflects true alpha or market exposure.
Actionable Uses
- Manager Selection
Identify managers that perform well in the market environments you expect. - Portfolio Construction
Combine strategies that perform well in different regimes to improve diversification. - Risk Management
Understand how strategies behave during market stress. - Performance Attribution
Distinguish between returns driven by market conditions and those driven by manager decisions.