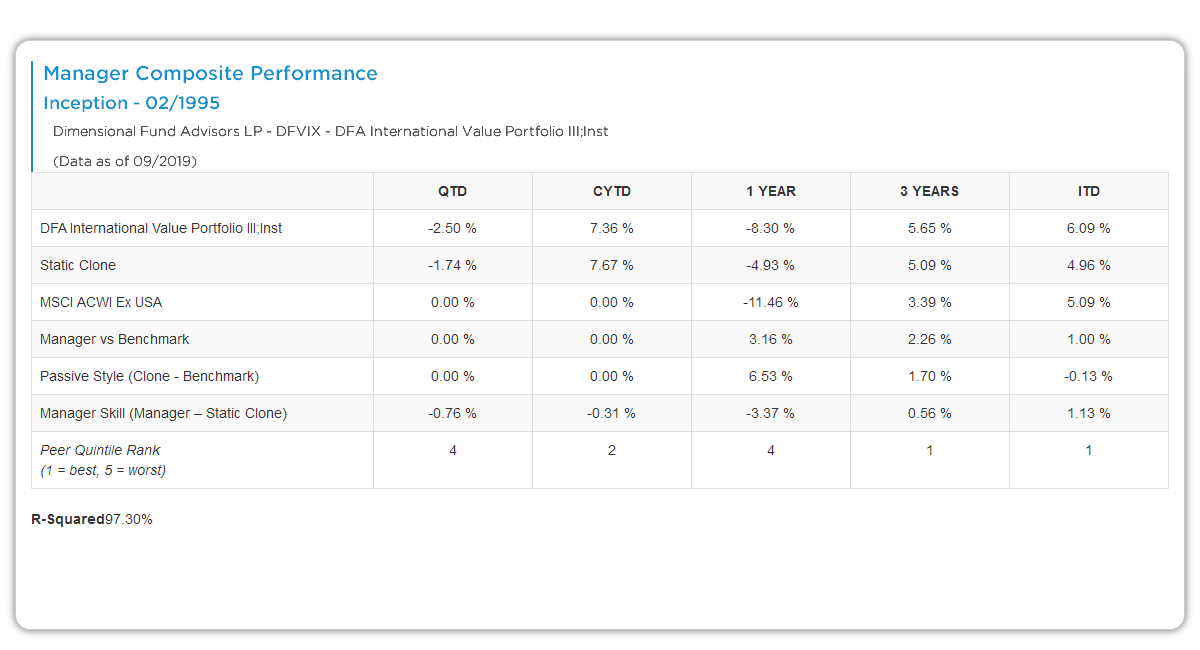
This comprehensive table summarizes a manager’s risk-adjusted performance across time horizons, ranked against peers in a specific style universe (e.g., Global Large High Quality Blend). It contextualizes raw returns with clone attribution, peer percentiles, and universe size for quick relative assessment.
Table Elements
Column Headers (Time Horizons, left to right):
- Peer Group: Specific Aapryl universe (e.g., Global Large High Quality Blend).
- QTD, CYTD, 1YR, 3YR, 5YR, ITD: Return periods—Quarter-To-Date (shortest), Calendar YTD, 1/3/5 Years, Inception-To-Date (longest). All annualized where applicable.
Row Breakdown:
- Manager Composite: The manager’s total return for each period (e.g., 0.84% CYTD).
- Static Clone (Long-Term Style Adj Bench): Passive long-term style replication return (e.g., 2.93% QTD)—what holding fixed factors yields.
- Benchmark (e.g., MSCI World): Broad index return (e.g., 3.12% QTD).
- Manager vs Benchmark: Excess return (Manager – Benchmark; e.g., -3.17% QTD).
- Style Effect (Clone Bench): Factor tilts’ contribution (e.g., -0.19% QTD).
- Peer Adjusted Alpha (Manager – Static Clone): Style-neutral skill excess (e.g., -2.99% QTD).
- Peer Quartile Rank (1 best, 4 worst): Manager’s percentile position (e.g., 5th percentile = top 5%, very strong).
- Peer Funds: Universe size per period (e.g., 246 funds QTD).
- R-Squared: Style explanation % (bottom row; e.g., 75% overall).
How It Works
Returns are gross or net composite (firm-wide), vs. benchmark and clones. Peer ranks use survivorship-free universe matching style. Alpha = Manager – Static Clone (pure skill). Positive ranks (1-2) + alpha confirm edge; R-squared validates decomposition reliability.
Key Insights to Spot
- Persistence Across Horizons: Consistent top-quartile ranks (1-2) signal repeatable skill vs. short-term luck.
- Alpha Drivers: Peer Adjusted Alpha >0 with good ranks shows skill beyond style.
- Style Impact: Negative Style Effect but positive alpha means manager overcame factor headwinds.
- Universe Context: Large # peers (200+) make ranks robust; watch shrinkage signaling universe changes.
- R-Squared Fit: 70-90% typical—high means style explains most; low flags unique strategy.
Actionable Uses
- Quick Screening: Scan for all 1-2 ranks + positive ITD alpha.
- Narrative Test: Strong ranks but negative style effect? Credit to skill.
- Capacity Check: Deteriorating ranks over longer horizons warn of scale issues.
- Comparisons: Benchmark against peers in same columns for relative bets.
- DD Deep Dive: Drill into periods with rank jumps for process questions.