Found in the Reporting Center, Custom Reporting allows you to build a custom report by selecting charts and graphs displayed throughout the platform as well as customize data points.
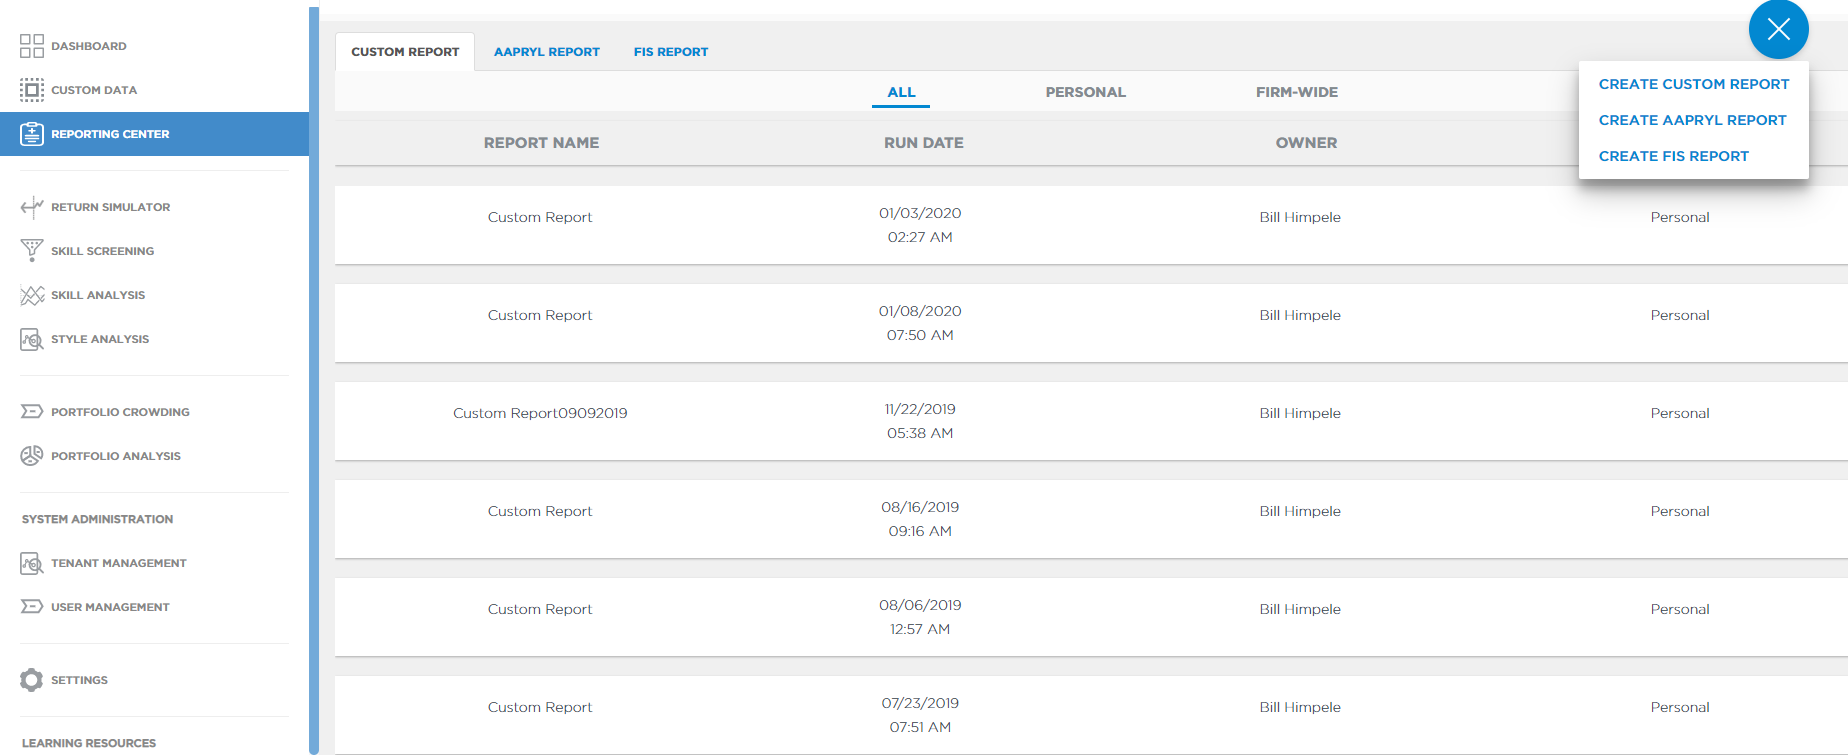
- Enter the reporting center by clicking the Reporting Center tab in the portal navigation bar. Click on the (+) symbol in the upper right corner of the screen and select create custom report.
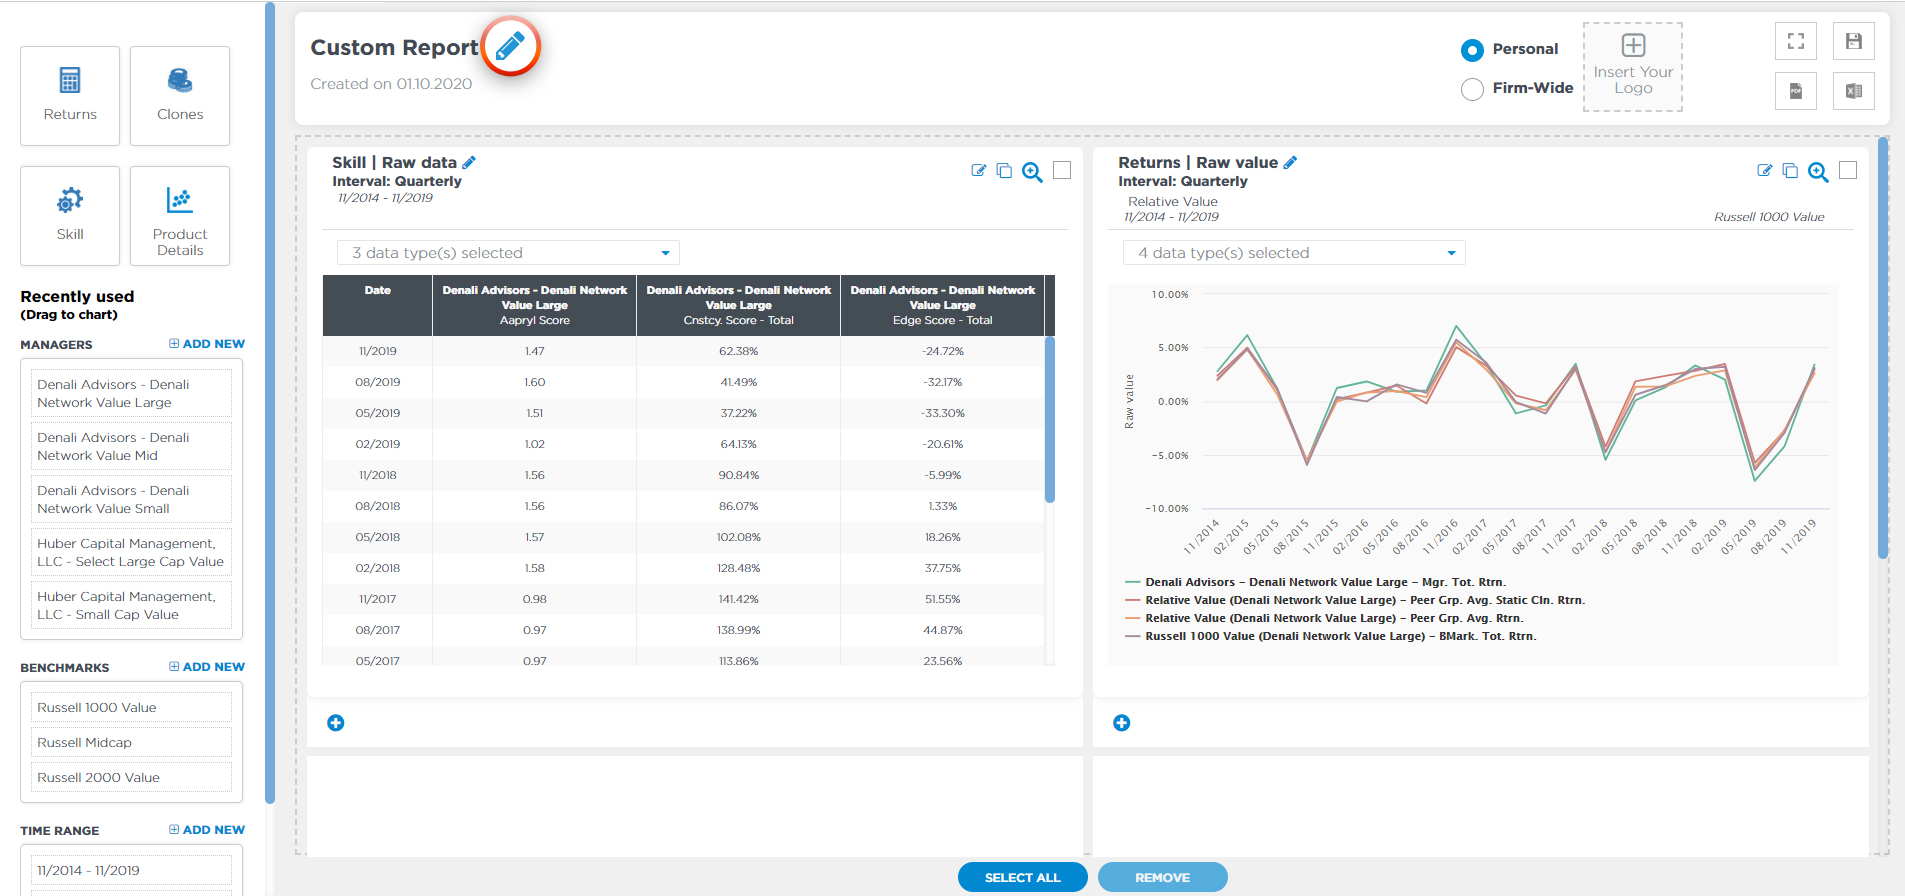
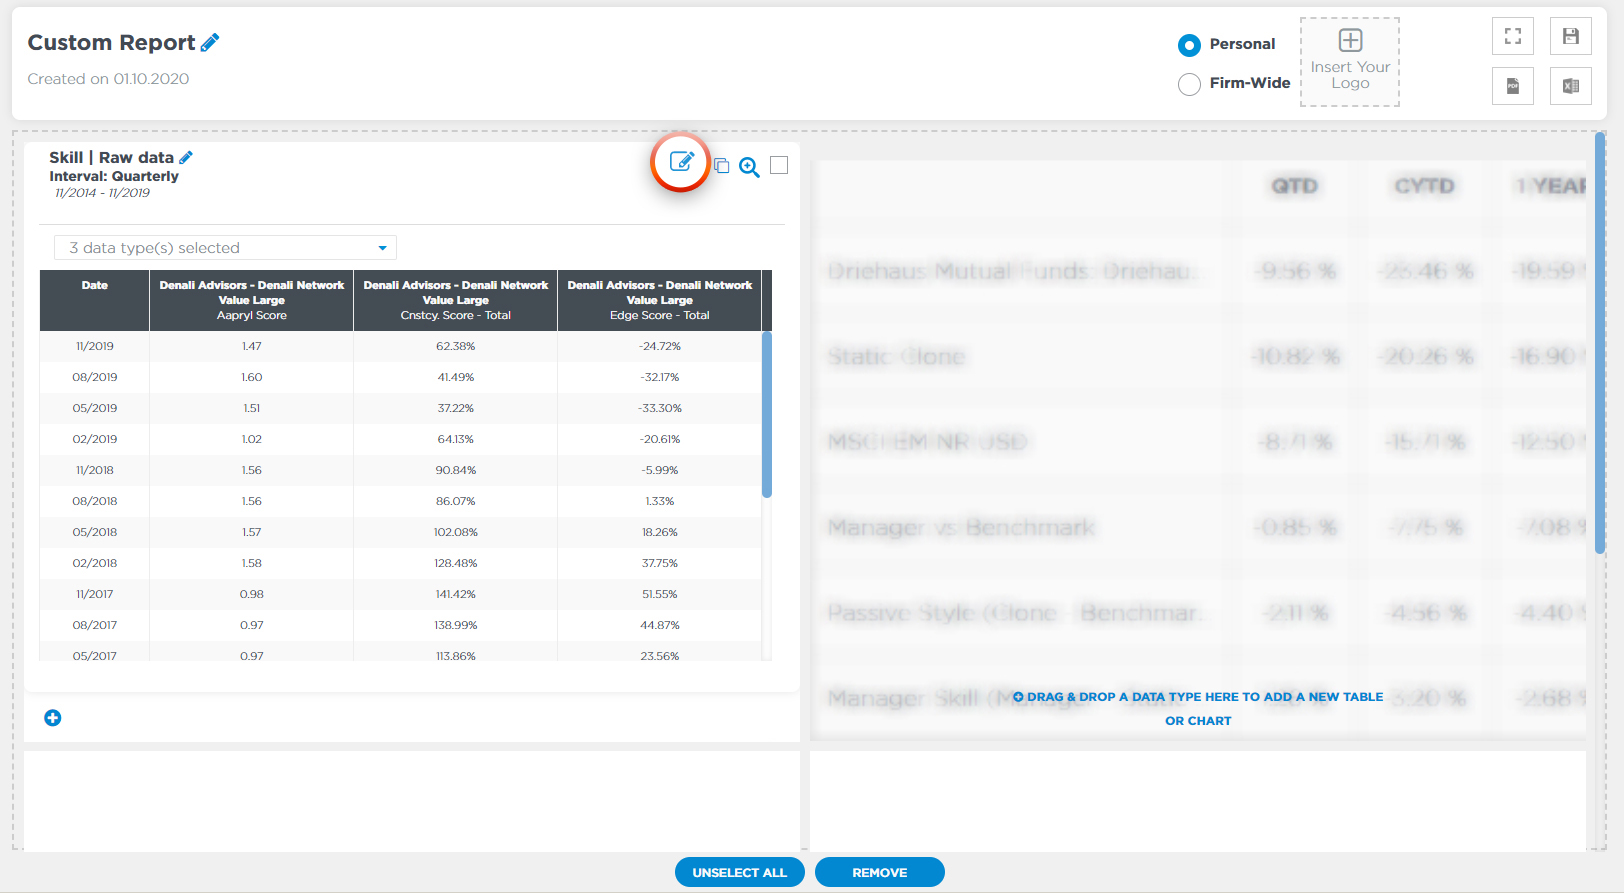
- Name your report by clicking the pencil icon next to the words “Custom Report”
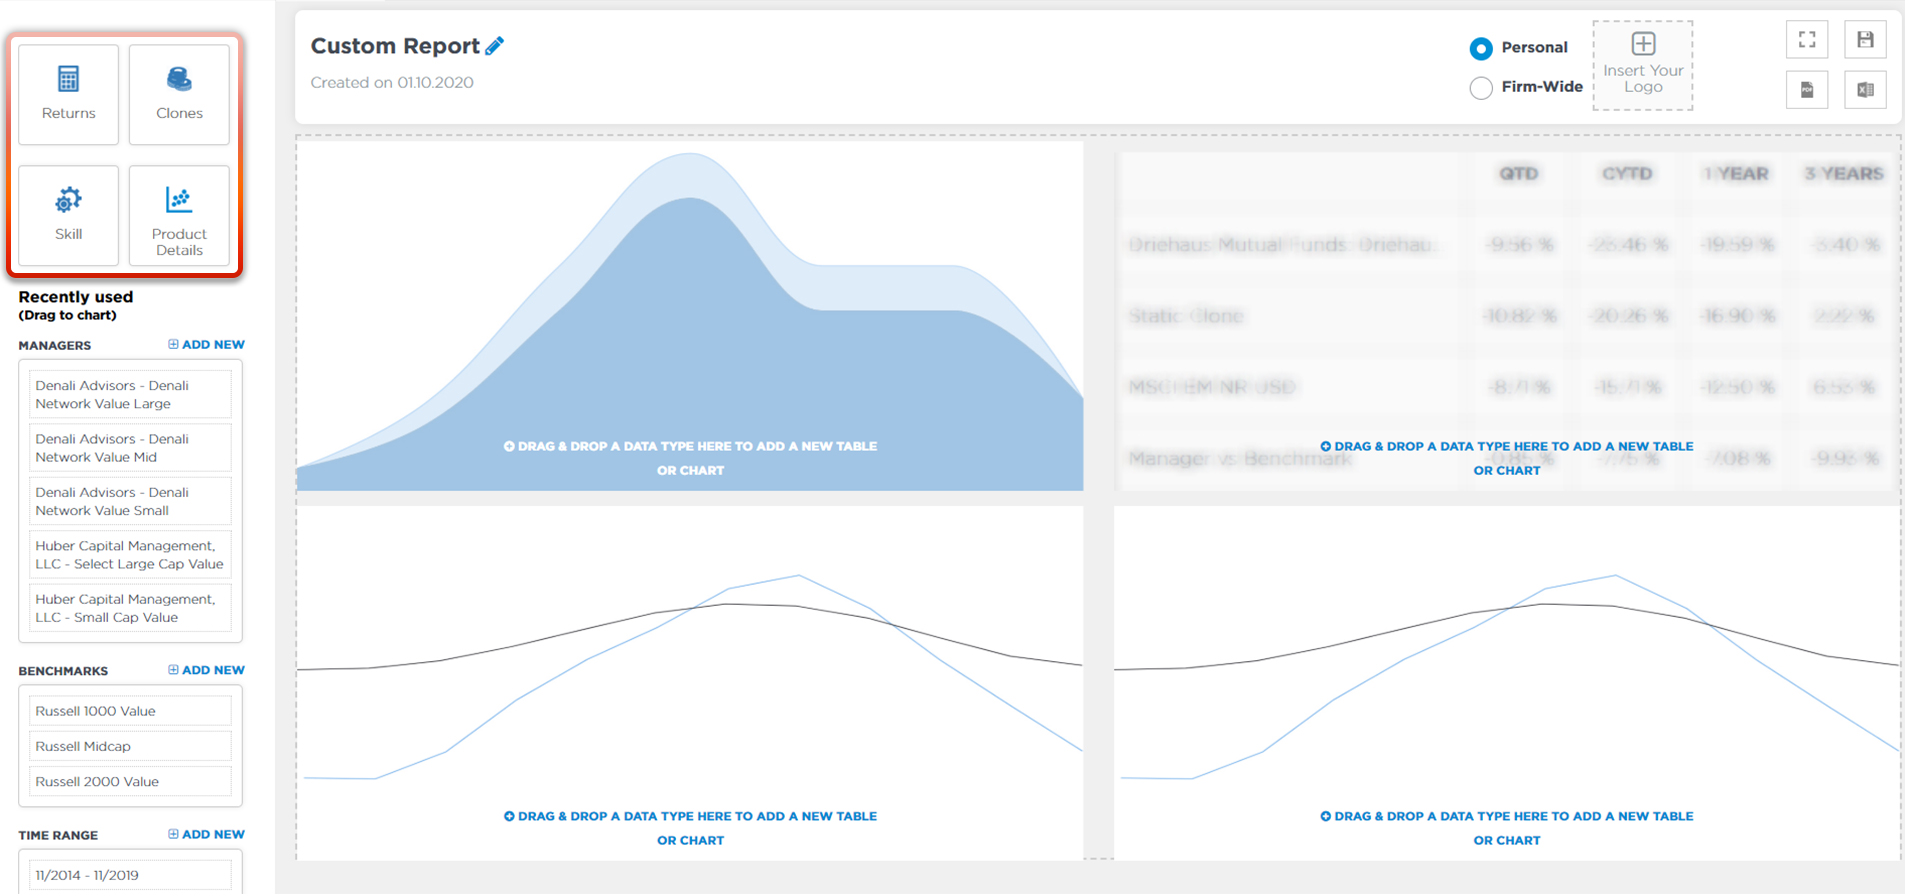
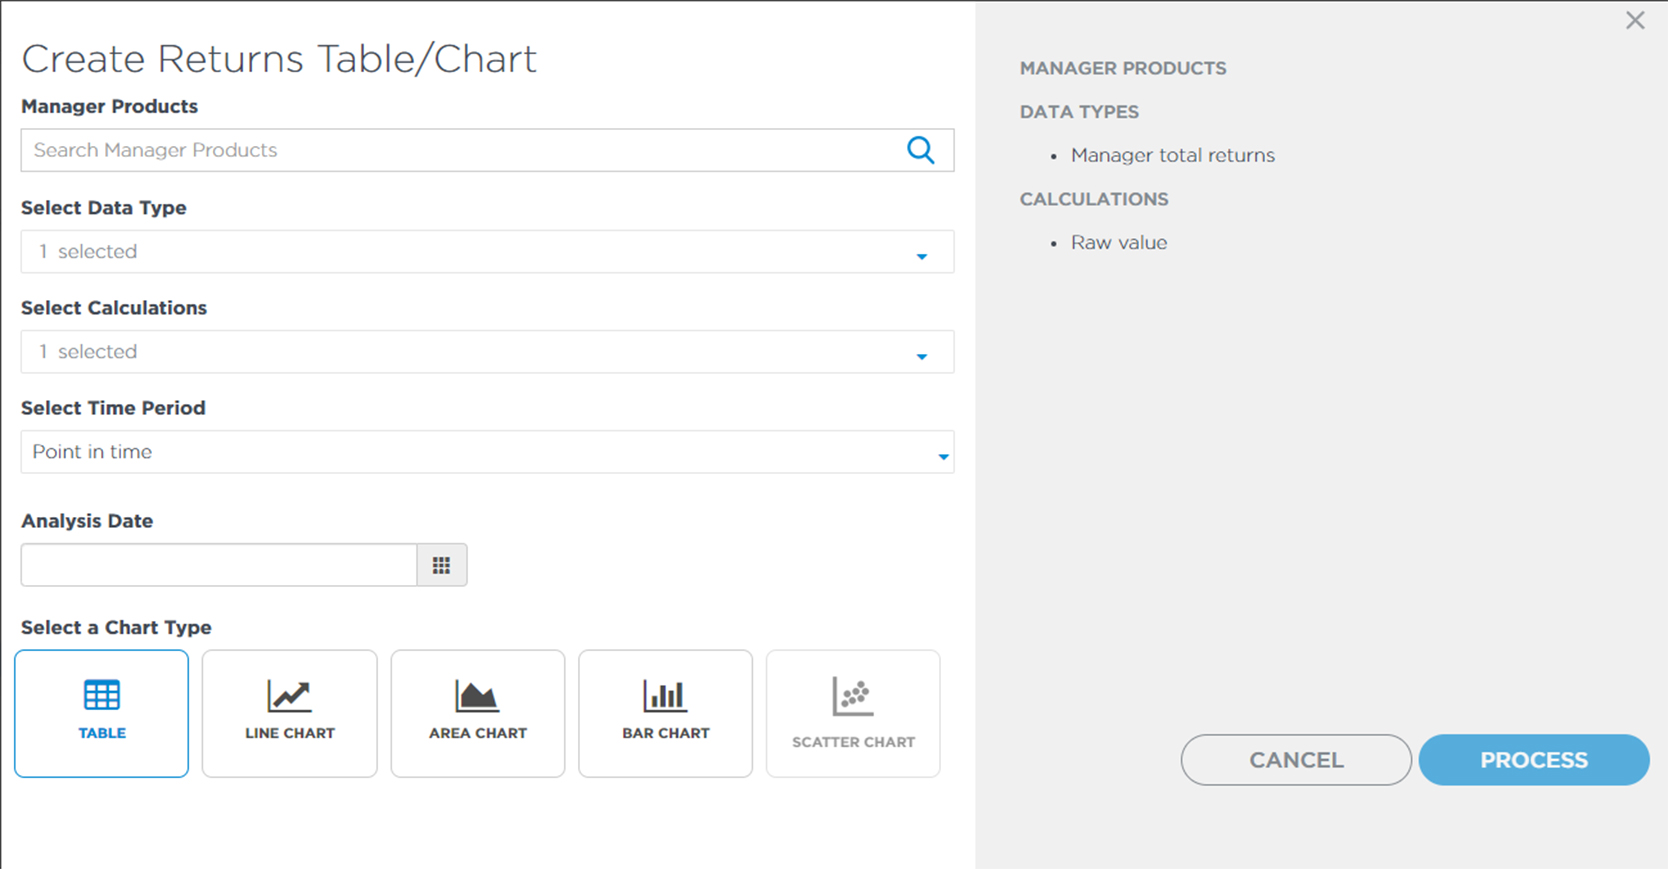
- To add charts and graphs to your custom report, select one of the four options on the left panel (returns, clones, skill, or product details) by either clicking the button or dragging the button into the report area of your choice.
- Once you’ve selected one of the four options, fill in the five required fields and the type of chart you would like then click “process”
- Once your table/graph is created, you are able to edit it by clicking the pencil in the upper right corner of the item.
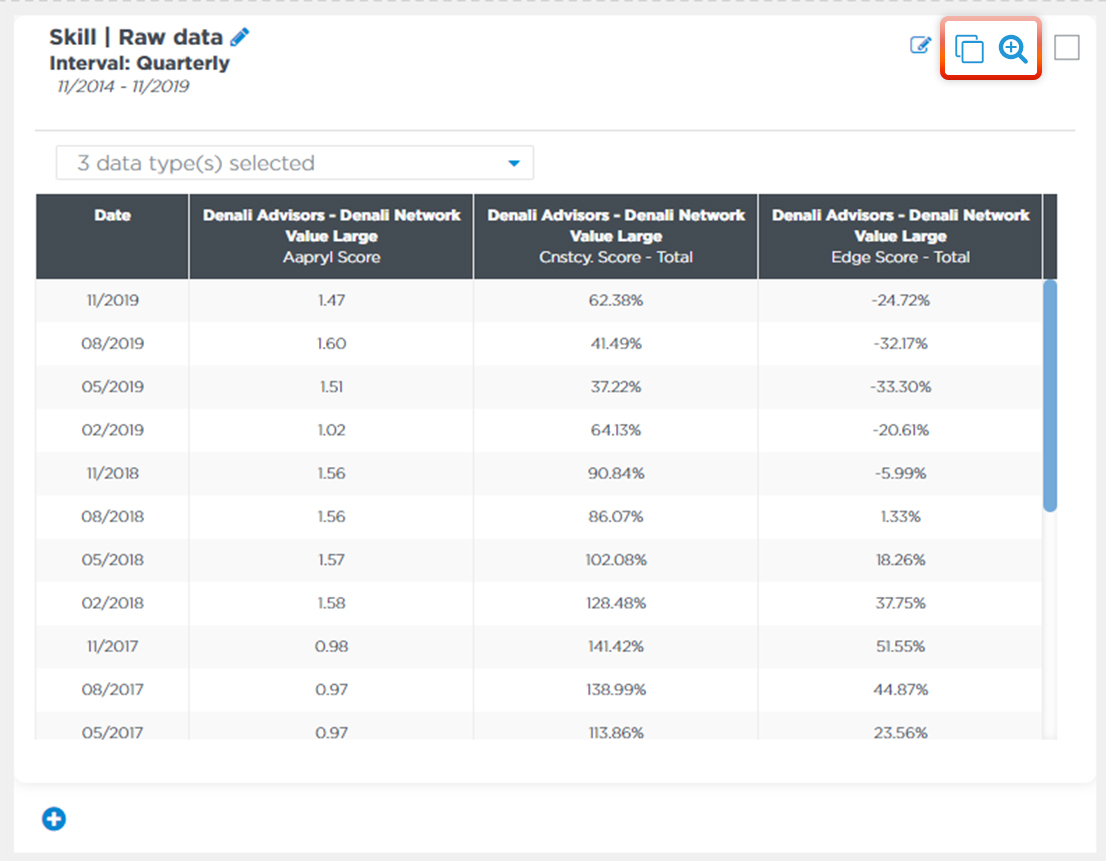
- You also have the option of duplicating or expanding a chart by selecting these buttons respectively
- Once you’ve added a chart or charts you are able to rearrange them by dragging and dropping them in the desired order.
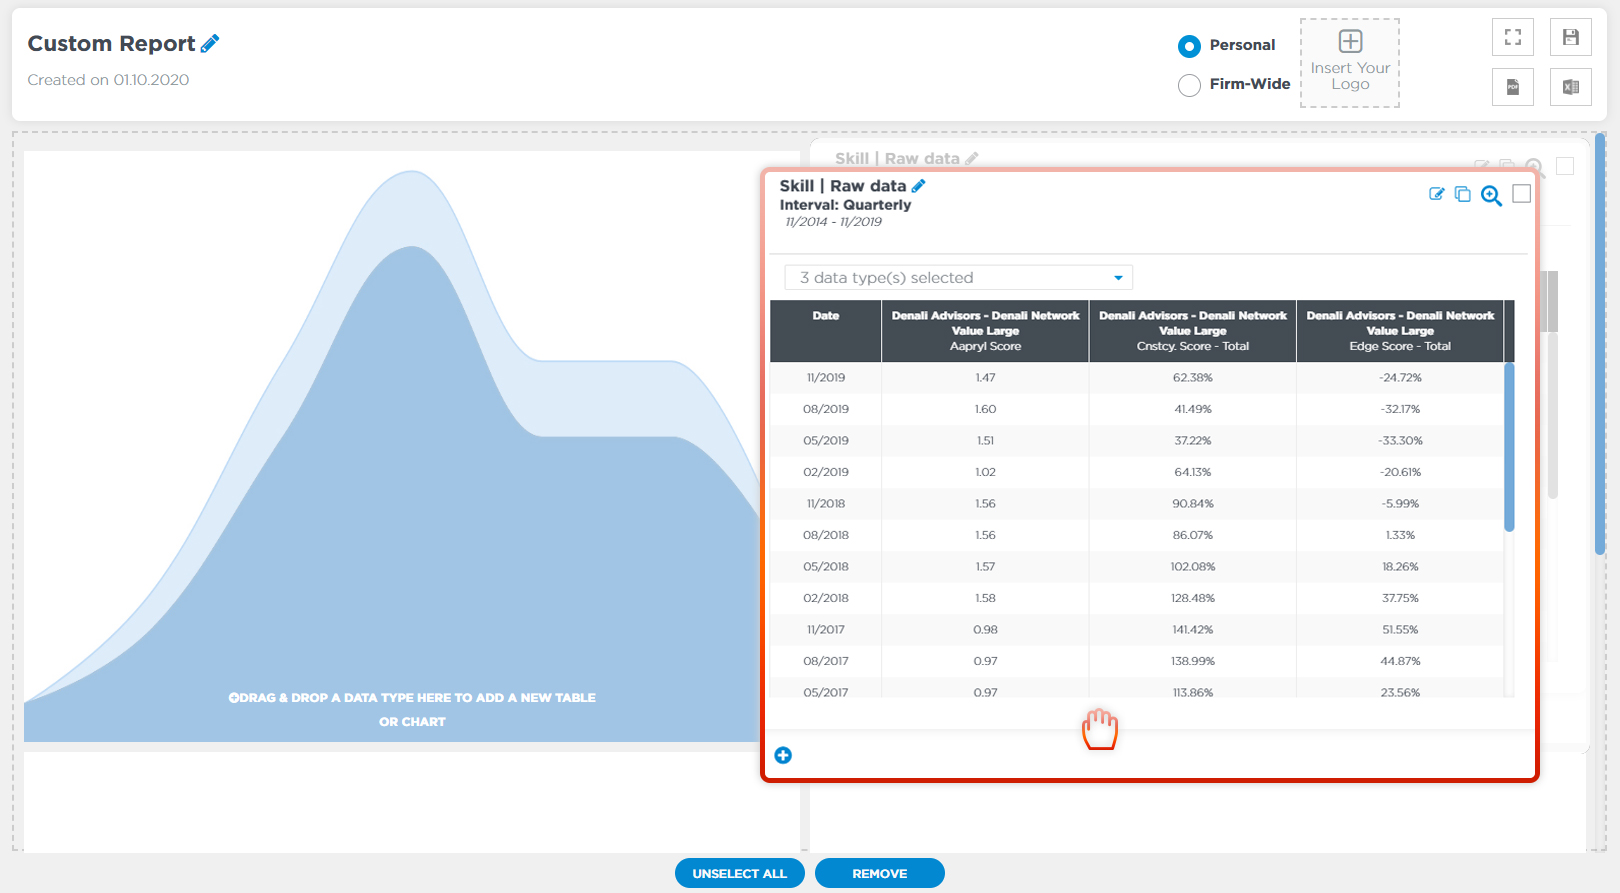
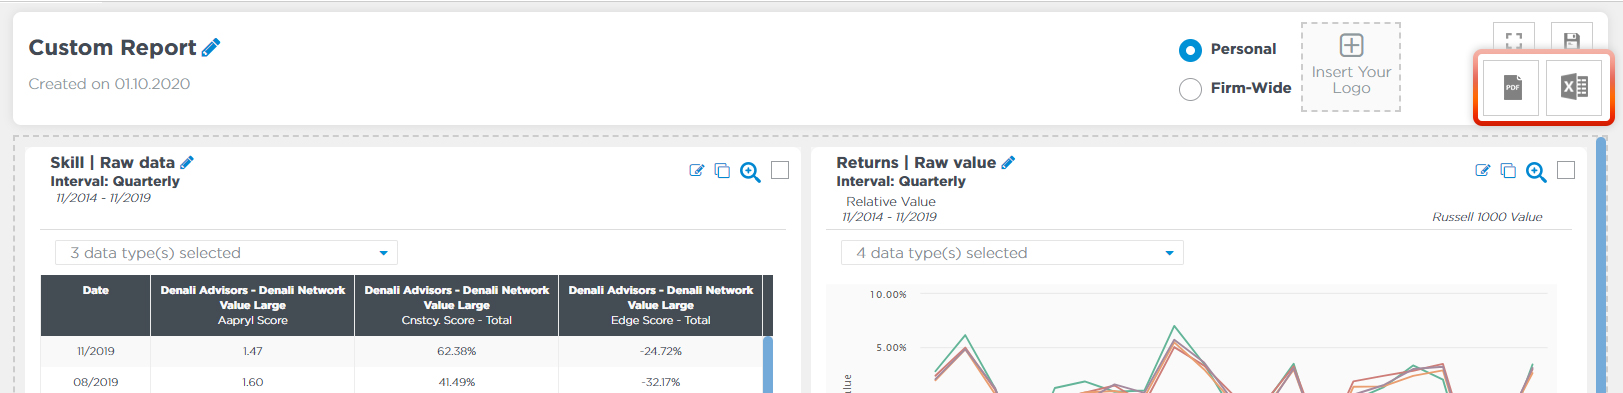
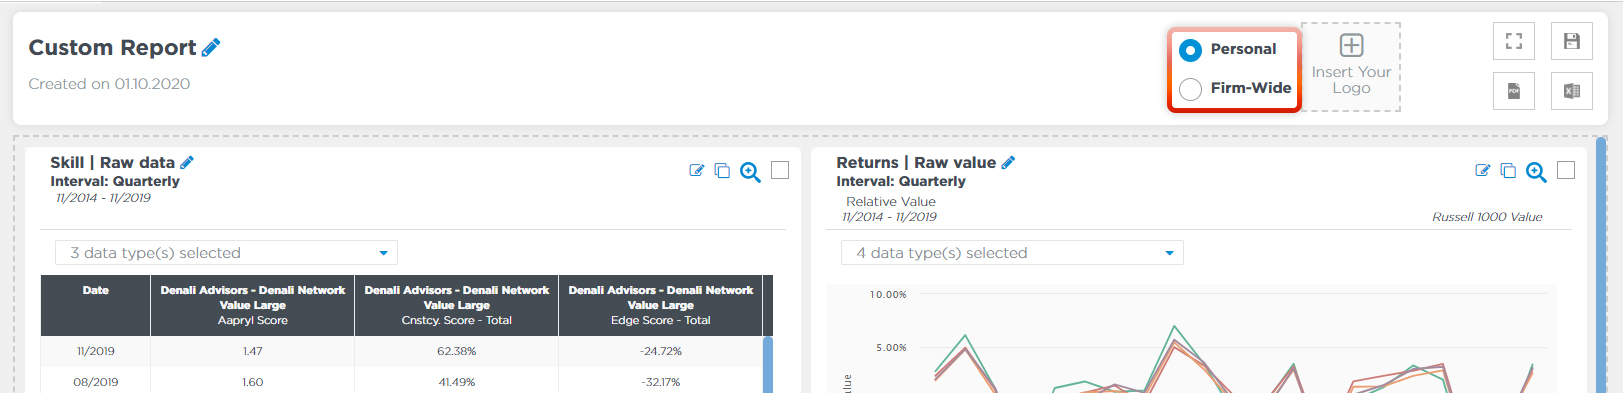
- Once you are finished editing your report, select either personal so only you can see your report or firm-wide so all your coworkers are able to access the report as well
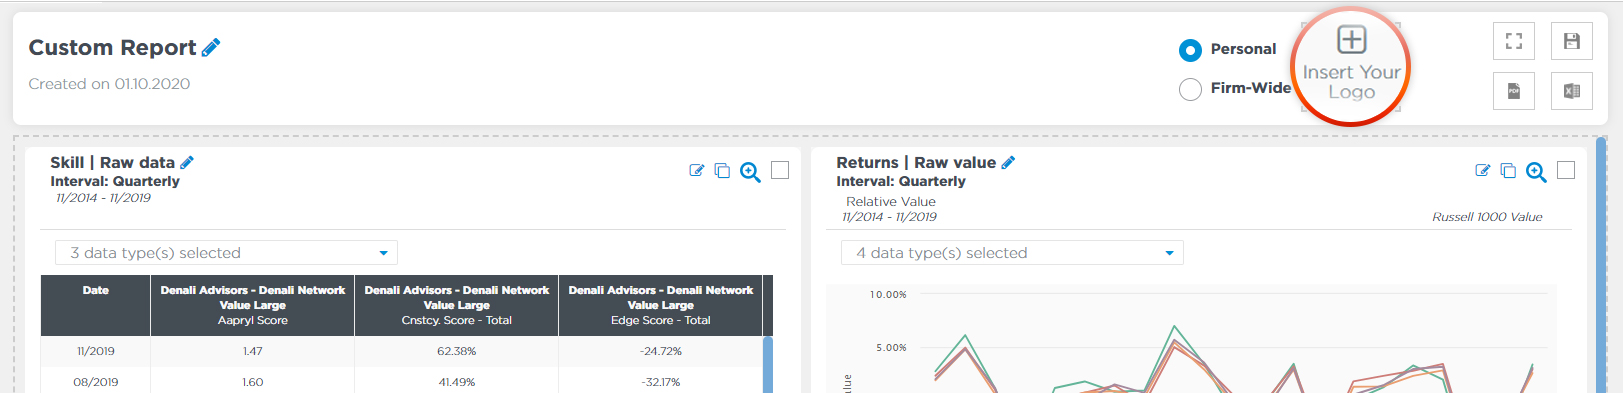
- You have the option of adding your logo to the report by selecting the “Insert Your Logo” button
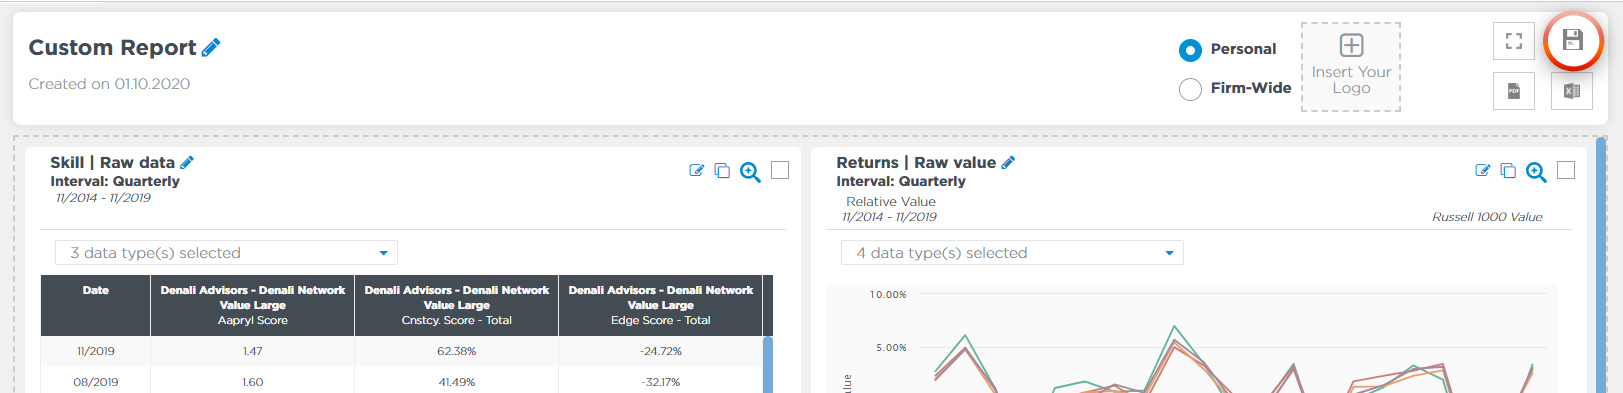
- To save the report, select the floppy disk icon in the upper right corner of the screen
- You can export your report via PDF or Excel. Both export option are located in the upper right corner of the page.