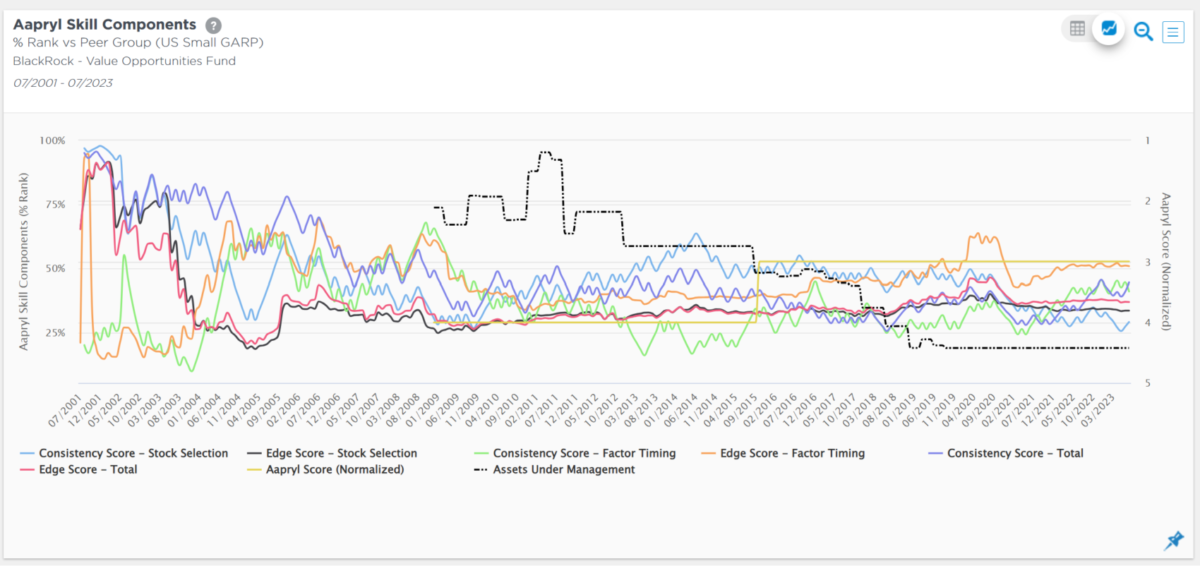
This chart decomposes manager skill into distinct components over time, showing how value is added beyond raw returns. Use it to evaluate persistence, key drivers like stock selection or timing, and alignment with market flows.
Chart Elements
- Lines: Track six skill components—Stock Selection Edge (magnitude of outperformance from security picks), Style Timing Edge (from factor/style shifts), Total Edge (combined), and their Consistency counterparts (frequency of positive results).
- Y-Axis: Z-scores normalized to peer-group percentiles (0 as average/50th percentile; positive = above peers).
- X-Axis: Monthly time series across market cycles, revealing trends and regime shifts.
- Dashed Line: Assets under management (AUM) in levels, overlaid to correlate capacity with skill evolution.
Aapryl’s Skill Methodology
Aapryl isolates true skill by subtracting passive “clones” from manager returns. Static clones replicate long-term factor exposures (e.g., quality, value). Dynamic clones adjust over rolling 36-month windows to capture recent style drifts. Excess return = manager minus dynamic clone (pure stock picks) + dynamic minus static (timing edge).
- Edge Metrics: Omega ratio-inspired—rewards large wins over small losses, scaled vs. peers.
- Consistency Metrics: Batting average of positive excess periods, risk-adjusted for track record length and market volatility.
- Z-Score Normalization: Ranks vs. specific peer universe (here, Global High Quality Blend), enabling cross-manager comparisons.
- Forward Prediction: Aggregates into Aapryl Score, forecasting 3-year top-quartile odds (high scores >60th percentile show ~70% hit rate in backtests).
This returns-based decomposition avoids self-reported biases, focusing on repeatable alpha sources.
Key Insights to Spot
- Skill Drivers: Dominant lines reveal if alpha comes from picks, timing, or balance.
- Persistence: Steady high ranks (>70th percentile) signal process strength; volatility flags regime dependence.
- AUM Correlation: Inflows during skill peaks validate market recognition of edge.
Actionable Uses
- Due Diligence: Confirm narrative (e.g., “quality stock pickers”) matches top-ranked selection lines.
- Monitoring: Watch for sustained drops in core components signaling process erosion.
- Manager Selection: Prioritize stable, high lines in mandate-aligned skills over total return alone.