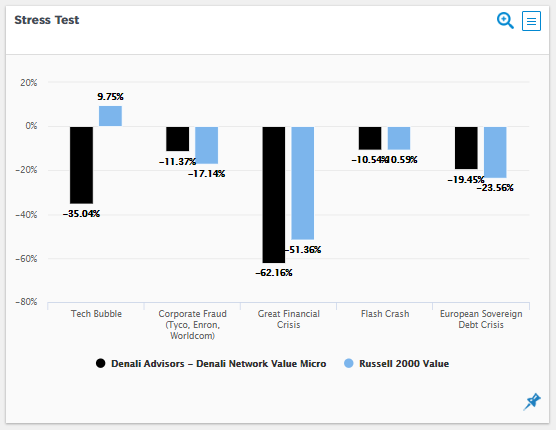
This bar chart evaluates a manager’s performance—and the benchmark’s—during predefined crisis periods or ones you define yourself, using clone-based attribution to separate style effects from genuine skill when markets are under extreme pressure. The visual pairing of bars makes it easy to see relative resilience at a glance.
Chart Elements
The layout uses simple grouped bars aligned to specific stress events on the X-axis, with the Y-axis scaling cumulative returns from roughly -50% to +50% to capture typical drawdown ranges. Every component serves a clear purpose:
- Stress Events (X-Axis, left to right): Factory presets include European Debt (04/2010-07/2011) for the sovereign crisis period, Flash Crash (06/2010) for the sudden volatility spike, March 2020 for the initial pandemic flash decline, COVID-19 (01/2020-03/2020) for the full early pandemic drop, and Great Financial Crisis (10/2007-02/2009) for the GFC meltdown. You create custom periods using the wizard when selecting managers—simply input start and end dates during manager setup to test tailored scenarios like rate hikes or sector shocks.
- Y-Axis (Return %): The total cumulative return from the period’s open to close. Negative numbers show the drawdown magnitude (e.g., -42% means a 42% peak-to-trough loss); positive values are uncommon but indicate relative outperformance or quick recovery.
- Bar Pairs (one black and one blue per event):
- Black Bars: The manager’s actual returns during that window (e.g., -7.6% in the European Debt crisis, showing limited damage).
- Blue Bars: The benchmark’s returns for the same exact period (e.g., MSCI World at -21.1% in March 2020, a much steeper fall).
- Legend:
- Black: Selected manager (e.g., GQG Partners LLC – GQG Partners Global Equity).
- Blue: Benchmark (MSCI World).
- Customization Path: Access via the manager selection wizard—define periods on-the-fly without separate platform tools.
The chart pulls data from inception (e.g., 10/2014 to 12/2025), only plotting events overlapping the track record.
How Stress Tests Are Calculated
All figures rely on the clone returns framework to ensure apples-to-apples stress analysis:
- Manager Actual: Straight cumulative return of the portfolio over the defined window.
- Benchmark: Identical calculation for the index.
- Clone Role (underlying attribution): Static and dynamic clones dissect if the manager’s style (e.g., high-quality stocks holding up in recessions) or skill (e.g., nimble selection/timing) explained relative strength. Windows are peak-to-trough standardized for fairness, and results aren’t annualized given the short, intense nature of crises.
When you create custom periods in the wizard, the same rigorous clone methodology applies automatically.
Key Insights to Spot
Focus on the black bar versus blue bar height in each event pair to uncover patterns:
- Relative Protection: A black bar noticeably less negative than the blue one (e.g., manager -4% vs. benchmark -21%) demonstrates superior downside management—crucial for real-world portfolios.
- Pattern Across Crises: Consistent black-bar advantage in multiple events (e.g., 4 out of 5) points to a repeatable defensive process, not luck.
- Style or Skill Driver: If the manager significantly outperformed, cross-reference clones (available in detailed views)—was it passive factor resilience or active decisions?
- Custom Scenario Power: Your wizard-defined periods (e.g., 2022 bear market) reveal current relevance beyond historical defaults.
- Amplification Effect: Crises magnify small edges seen in normal times, validating or debunking skill claims.
Actionable Uses
This chart fits seamlessly into risk assessment and decision-making:
- Resilience Prioritization: Favor managers where black bars are shallower than blue across most events, especially customs matching your risk views.
- Due Diligence Prep: Reference specific bars like “Your -8% in COVID beat the benchmark’s -42%—walk us through the positioning.”
- Portfolio Stress Modeling: Aggregate top black-bar performers to simulate blended crisis returns.
- Custom Testing: Use the manager selection wizard for “what-if” periods like geopolitical flares, ensuring hires withstand your scenarios.
- Capacity Correlation: Combine with AUM charts—if strong black bars persist at high assets, the process scales through turmoil.
By enabling wizard-based custom periods, this chart evolves from historical review to forward-looking stress validation.