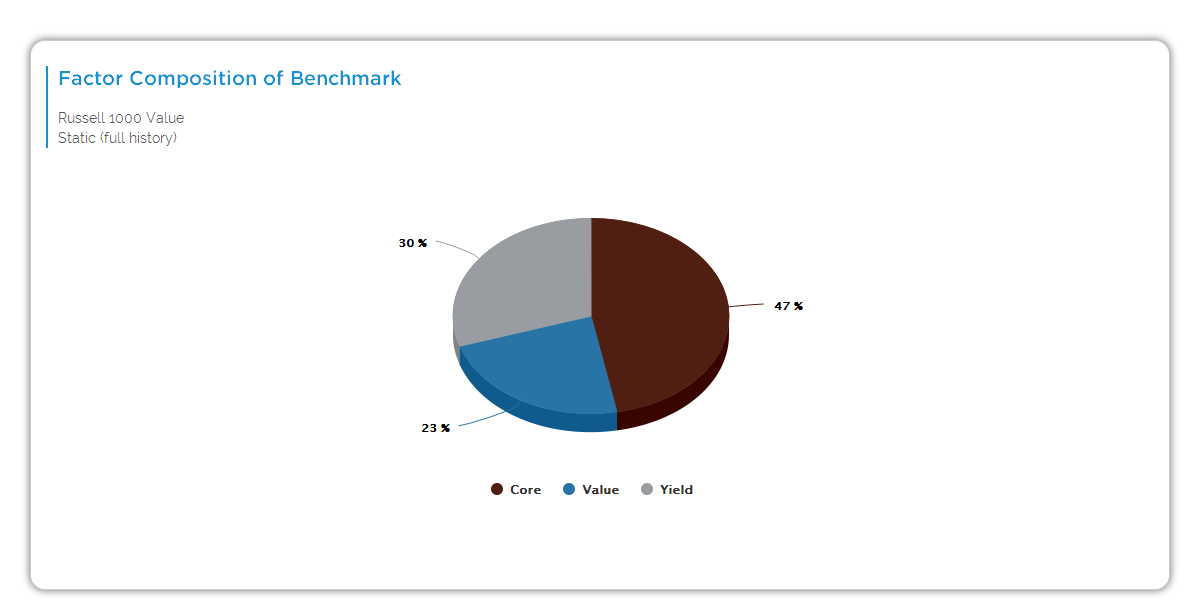
This pie chart displays the factor exposures of the selected benchmark (e.g., MSCI World), using static (full history) or dynamic (recent 36 months) clone methodology. Toggle between factor, distinct, cap size, or region views to analyze exposures across available factors depending on the benchmark.
Chart Elements
- The center pie shows benchmark factor breakdown by percentage (e.g., 46% Value blue, 25% Economic Sensitivity gray, 25% Growth yellow, 19% Quality green).
- The X-axis labels identify factors: Economic Sensitivity (gray), Growth (yellow), Quality (green), Value (blue).
- The toggle buttons allow Static (full history) vs. Dynamic (most recent 36 months) clone calculation.
- The radio buttons switch between Distinct and Factor decomposition modes.
- Cap Size and Region toggles enable additional breakdowns.
- Benchmark selector shows current selection with period dropdown (e.g., most recent 36 months).
- Data as-of notes recency (e.g., 12/2025).
How It Works
Aapryl builds static clones from inception-period factor loadings and dynamic clones from rolling 36-month windows. Available factors (depending on benchmark): Value (low P/E, P/B), Core (neither value/growth), Growth (high growth rates, P/E, P/B), Defensive (stability via low earnings variability, high ROA, low leverage), Economic Sensitivity (cyclical based on earnings variability, ROA, leverage), Momentum (high price momentum), Quality (high ROA, low leverage, earnings stability), Yield (high dividend yields), Low Volatility (lowest std. dev. or beta). Distinct aggregates similar factors; Factor shows granular split.
Key Insights to Spot
Dominant slice reveals primary tilt (e.g., 46% Value). Dynamic vs. static divergence signals evolving exposures. High Quality or Low Volatility % explains defensive behavior. Economic Sensitivity dominance flags cyclical bets. Factor availability varies by benchmark universe.
Actionable Uses
Match manager clones to benchmark factors for style fit. Screen benchmarks aligning with portfolio mandate. Probe factor mismatches in DD meetings. Monitor dynamic shifts for regime changes. Compare across universes for allocation decisions.